
What Are Learning Curves and Why You Should Care About Them
The Ultimate Guide to Learning Curves for Machine Learning in Python


Before we begin make sure you check the previous article in this series here
How do we know if our models are learning well or not? How do we measure their performance and improvement over time? How do we diagnose and fix common problems such as underfitting or overfitting? One of the tools that can help us answer these questions is learning curves.
What are learning curves?
A learning curve is a plot that shows how a model's performance changes as it gains more experience or data. Typically, a learning curve has two axes: the x-axis represents the amount of experience or data, and the y-axis represents the performance metric, such as accuracy, error, loss, etc. A learning curve can help us visualize and understand how our model is learning and what factors affect its performance.
There are different types of learning curves depending on what we want to analyze. For example:
- A training curve shows how the model's performance on the training data changes as it trains on more data or epochs (iterations).
- A validation curve shows how the model's performance on a separate validation data set changes as it trains on more data or epochs. The validation data set is used to evaluate the model's generalization ability, i.e., how well it can perform on new unseen data.
- A test curve shows how the model's performance on a separate test data set changes as it trains on more data or epochs. The test data set is used to measure the final performance of the model after it has been trained and tuned.
How to interpret learning curves?
Learning curves can provide valuable insights into our model's behavior and help us identify potential problems and solutions. Here are some common scenarios and interpretations:
- If both training and validation curves are high and close to each other, it means that our model has low bias (underfitting) and low variance (overfitting). It means that our model is well-fit to the data and has good generalization ability.
- If both training and validation curves are low and close to each other, it means that our model has high bias (underfitting) and low variance (overfitting). It means that our model is too simple to capture the data and has poor performance.
To fix underfitting, we can try:
Increasing the model complexity: Our model may be too simple to capture the patterns in the data. We can try adding more layers, neurons, or features to make it more expressive and flexible.
Reducing regularization: Regularization is a technique to prevent overfitting by adding a penalty to the model complexity. However, if our model is already underfitting, we don’t want to penalize it further. We can try reducing or removing regularization terms such as L1 or L2 norms, dropout rates, etc.
Changing the hyperparameters: Hyperparameters are parameters that are not learned by the model but set by us before training. They can affect the model’s performance and learning speed. We can try tuning hyperparameters such as learning rate, batch size, number of epochs, etc., using techniques such as grid search or random search.
How to plot learning curves?
There are different ways to plot learning curves depending on what tools and frameworks we use for machine learning. For example:
If we use scikit-learn, we can use the learning_curve function from sklearn.model_selection module. It returns an array of training scores and validation scores for different sizes of training sets. We can then plot these scores using matplotlib or seaborn libraries.
If we use TensorFlow or Keras, we can use the history object returned by the fit method of our model. It contains a dictionary of metrics values for each epoch of training and validation. We can then plot these values using matplotlib or seaborn libraries.
If we use PyTorch, we can use torch.utils.tensorboard module to log metrics values during training and validation. We can then visualize these values using TensorBoard dashboard.
Here is an example of a learning curve for logistic regression using scikit-learn:
# Import libraries
import numpy as np
import matplotlib.pyplot as plt
from sklearn.datasets import load_digits
from sklearn.linear_model import LogisticRegression
from sklearn.model_selection import learning_curve

# Load data
X, y = load_digits(return_X_y=True)

# Define model
model = LogisticRegression(max_iter=1000)

# Get learning curve data
train_sizes, train_scores, val_scores = learning_curve(model, X, y, cv=5, scoring='accuracy', n_jobs=-1)

# Compute mean and standard deviation for training and validation scores
train_mean = np.mean(train_scores,axis=1)
train_std = np.std(train_scores,axis=1)
val_mean = np.mean(val_scores,axis=1)
val_std = np.std(val_scores,axis=1)

# Plot learning curve
plt.plot(train_sizes, train_mean, label='Training score')
plt.plot(train_sizes, val_mean, label='Cross-validation score')

# Plot confidence intervals
plt.fill_between(train_sizes, train_mean - train_std,
                 train_mean + train_std,
                 color='#DDDDDD')
plt.fill_between(train_sizes,
                 val_mean - val_std,
                 val_mean + val_std,
                 color='#DDDDDD')

# Add labels and title
plt.title('Learning Curve for Logistic Regression')
plt.xlabel('Training Set Size')
plt.ylabel('Accuracy Score')
plt.legend()
plt.show()
The output of this code would look like this:
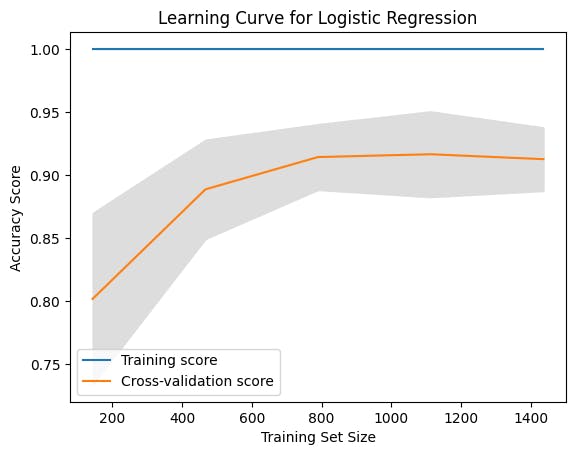
You can tweak the code above, to see if the training score decreases slightly as more data is added while the cross-validation score increases. When this happens, it indicates that the model is not overfitting or underfitting the data too much.
Conclusion
Learning curves are useful tools to monitor and diagnose our machine learning models during training. They can help us identify problems such as underfitting or overfitting and suggest possible solutions such as adding more data, changing model complexity or regularization parameters. Learning curves can also help us compare different models or hyperparameters and choose the best one for our problem.
I hope you enjoyed this article and learned something new about learning curves in machine learning. Thank you for reading! 😊
See the next article in this series here [coming soon]